This is going to sound strange, but a paper titled The lifespan evolution of individualized neurophysiological traits reads a bit like a Victorian ghost story about a haunted EEG cap. The actual experiment is better: scientists took quiet, task-free brain recordings from more than 1,000 people aged 4 to 89 and asked how much your brain activity looks like you across a whole lifetime. (da Silva Castanheira et al., 2025)
The tool here was magnetoencephalography, or MEG, which listens to the magnetic whispers produced by firing neurons. It does not read your thoughts, which is a mercy. What it can do is capture brain timing and rhythm with absurd precision.
The big result is counterintuitive. In childhood, brains are more similar to one another overall, especially in their aperiodic activity - the broad background slope of neural noise rather than neat rhythms. But periodic activity like alpha and beta already works as a solid marker of individuality. So even when kids' brains are still under construction, some parts of the signal already behave like a personal signature.
Think of aperiodic activity as the room tone in a movie scene, while periodic activity is the music cue. The room tone changes with the building. The music tells you whose entrance this is.
Puberty, But for Brain Fingerprints
One of the most interesting parts of the paper is that the brain regions carrying the most individuality change with age. In adults, sensorimotor cortex becomes especially distinctive. That is a fun plot twist, because we usually talk about identity in terms of memory, personality, and other high-status mental drama. Meanwhile, the circuits involved in sensing and moving are quietly making your resting brain activity look specifically like yours.
The authors also found that these age-related shifts line up with cortical gene-expression patterns related to ion transport and neurotransmission, with the strongest alignment in late adolescence. In plain English: as the brain matures, the link between its electrical style and its molecular wiring seems to tighten. Late adolescence may be the point where biology starts signing its work in bolder ink.
That idea fits with a growing literature suggesting that brain "fingerprints" are real, measurable, and annoyingly dependent on method. MEG studies show that some connectivity patterns are stable enough to identify individuals across repeated scans, although the exact fingerprint depends on how you measure connectivity and which frequency band you use (Sareen et al., 2021). Researchers have also argued that the bigger goal is not just identifying a person like a brain-themed passport officer, but figuring out which signatures actually predict behavior, risk, or resilience (Finn and Rosenberg, 2021).
Why Anyone Outside a Scanner Should Care
If these findings keep holding up, they point toward a more personal way of doing neuroscience. A lot of brain research still averages people together until everybody starts to look like the statistical cousin of nobody in particular.
An individualized neurophysiology marker could become a baseline for tracking change over time. Not diagnosing from one scan, and definitely not fortune-telling with a helmet, but asking: does this person's brain still look like their own usual pattern? That could matter for aging, early neurodegenerative change, concussion recovery, or treatment monitoring. Researchers studying adult aging already report reliable lifespan shifts in synchrony and oscillatory dynamics, which is why people keep circling this area as a possible biomarker gold mine, despite the usual cave-ins (Pathak et al., 2022; Huang et al., 2024).
There is also a quieter implication here. We often talk about aging as decline, as if the brain were a phone battery with worsening customer support. This paper suggests something more nuanced. Some features become more individualized with age. Some rhythms stay reliably yours from early on.
The Messy Part, Because Of Course There’s a Messy Part
None of this means scientists have found a ready-to-use brain barcode. MEG is expensive, specialized, and not exactly hanging out next to the blood pressure cuff at your local clinic. This was also a cross-sectional study, so it compares different people at different ages rather than following the same people across decades. And linking brain activity to gene-expression maps is powerful, but still one step removed from proving direct cause.
Still, this is a sharp paper. It suggests that your brain's individuality is not one static thing that appears fully formed and then sits there like a framed diploma. It changes. Some of it arrives early. Some of it intensifies with age. And by late adolescence, your neural style may be less like a rough sketch and more like someone finally committing to the brushstrokes.
References
- da Silva Castanheira J, Wiesman AI, Taylor MJ, Baillet S. The lifespan evolution of individualized neurophysiological traits. Cell Reports. 2025;44(12):116657. DOI: https://doi.org/10.1016/j.celrep.2025.116657
- Sareen E, Zahar S, Van De Ville D, Gupta A, Griffa A, Amico E. Exploring MEG brain fingerprints: Evaluation, pitfalls, and interpretations. NeuroImage. 2021;240:118331. DOI: https://doi.org/10.1016/j.neuroimage.2021.118331
- Finn ES, Rosenberg MD. Beyond fingerprinting: Choosing predictive connectomes over reliable connectomes. NeuroImage. 2021;239:118254. DOI: https://doi.org/10.1016/j.neuroimage.2021.118254
- Pathak A, Sharma V, Roy D, Banerjee A. Biophysical mechanism underlying compensatory preservation of neural synchrony over the adult lifespan. Communications Biology. 2022;5:567. DOI: https://doi.org/10.1038/s42003-022-03489-4. PMCID: https://pmc.ncbi.nlm.nih.gov/articles/PMC9184644/
- Huang Y, Cao C, Dai S, Deng H, Su L, Zheng JS. Magnetoencephalography-derived oscillatory microstate patterns across lifespan: the Cambridge Centre for Ageing and Neuroscience cohort. Brain Communications. 2024;6(3):fcae150. DOI: https://doi.org/10.1093/braincomms/fcae150. PMCID: https://pmc.ncbi.nlm.nih.gov/articles/PMC11091929/
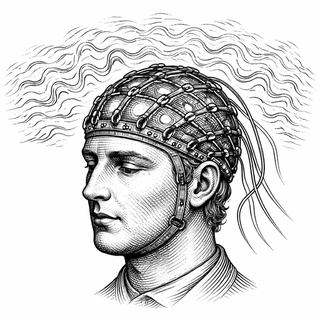
Disclaimer: The image accompanying this article is for illustrative purposes only and does not depict actual experimental results, data, or biological mechanisms.